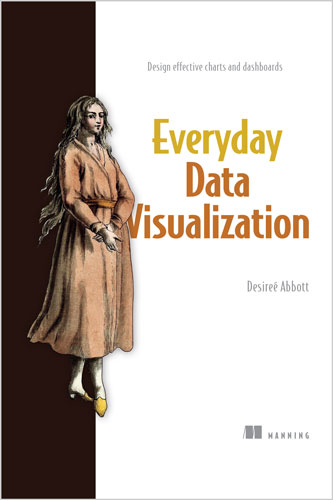
📊 این کتاب بهت کمک میکنه کیفیت مصورسازی دادههات (Data Visualization) رو با استفاده از اصول اصلی رنگ، تایپوگرافی، انواع نمودارها و داستانسرایی دادهها، حسابی بالا ببری.
🛠 کتاب Everyday Data Visualization یه راهنمای عملی برای تکنیکهای طراحی هست که نمودارها، گزارشها و داشبوردهایی که هر روز میسازی رو بهتر میکنه. هر چیزی که اینجا یاد میگیری وابسته به ابزار خاصی نیست (Tool-agnostic) و اصول جهانی داره که روی هر استک دادهای قابل اجراست.
🎓 در کتاب Everyday Data Visualization یاد میگیری:
• استفاده از قدرت ادراک برای هدایت توجه کاربر
• جون دادن به دادهها با استفاده از رنگ و تایپوگرافی
• انتخاب بهترین نوع نمودار برای داستان دادههای خودت
• طراحی برای مصورسازیهای تعاملی (Interactive)
• اولویت دادن به نیازهای کاربر در تمام طول پروژه
🛠 درباره تکنولوژی
💡 حتی ارائههای معمولی مثل نمودارها، داشبوردها و اینفوگرافیکها میتونن به داستانهای دادهای جذاب و الهامبخش تبدیل بشن! این کتاب نشونت میده چطور ویژوالیزیشنهایی که هر روز میسازی رو با بهبود چیدمان، تایپوگرافی، رنگ و دسترسیپذیری ارتقا بدی. اصول طراحی موندگاری رو کشف میکنی که کمکت میکنه ویژگیهای مهم رو برجسته کنی، اطلاعات ناقص رو جبران کنی و با جریانهای داده زنده تعامل داشته باشی.
📖 درباره کتاب
📘 کتاب Everyday Data Visualization تو رو در مسیر گرافیک دیزاین پایه برای رایجترین انواع مصورسازی داده راهنمایی میکنه.
🎨 یاد میگیری چطور نمودارها رو با رنگ جذابتر کنی، کاربرها رو به تعامل و کاوش در دادهها تشویق کنی و ویژوالیزیشنهایی بسازی که برای همه قابل دسترسی باشه.
🚀 در طول مسیر، هر مهارت جدیدی که یاد میگیری رو تمرین میکنی و یه پروژه داشبورد رو از مرحله تحقیق تا انتشار پیش میبری.
📦 آنچه در این کتاب است
• زنده کردن دادهها با رنگ و تایپوگرافی
• انتخاب بهترین انواع نمودار برای داستان دادههات
• طراحی ویژوالیزیشنهای تعاملی
👥 درباره خوانندگان
💻 مناسب برای کسانی که با ابزارهای تحلیل داده تجربه دارن.
📑 فهرست مطالب
بخش ۱
۱. سلام، دیتا ویژوالیزیشن!
۲. چطور اطلاعات رو درک میکنیم
۳. همش درباره دادهست
بخش ۲
۴. انتخاب رنگها
۵. تایپوگرافی
۶. ساخت یک نمودار خوب
۷. طراحی برای تعاملپذیری
بخش ۳
۸. تحقیق، طراحی و توسعه
۹. عیبیابی
👨💻 درباره نویسنده
👩🔬 دزیره ابوت (Desireé Abbott) بیش از یک دهه تجربه در تحلیل محصول، هوش تجاری، علوم داده، طراحی و مهندسی نرمافزار داره.
Radically improve the quality of your data visualizations by employing core principles of color, typography, chart types, data storytelling, and more.
Everyday Data Visualization is a field guide for design techniques that will improve the charts, reports, and data dashboards you build every day. Everything you learn is tool-agnostic, with universal principles you can apply to any data stack.
In Everyday Data Visualization you’ll learn important design principles for the most common data visualizations:
- Harness the power of perception to guide a user’s attention
- Bring data to life with color and typography
- Choose the best chart types for your data story
- Design for interactive visualizations
- Keep the user’s needs first throughout your projects
This book gives you the tools you need to bring your data to life with clarity, precision, and flair. You’ll learn how human brains perceive and process information, wield modern accessibility standards, get the basics of color theory and typography, and more.
About the technology
Even mundane presentations like charts, dashboards, and infographics can become engaging and inspiring data stories! This book shows you how to upgrade the visualizations you create every day by improving the layout, typography, color, and accessibility. You’ll discover timeless principles of design that help you highlight important features, compensate for missing information, and interact with live data flows.
About the book
Everyday Data Visualization guides you through basic graphic design for the most common types of data visualization. You’ll learn how to enhance charts with color, encourage users to interact and explore data and create visualizations accessible to everyone. Along the way, you’ll practice each new skill as you take a dashboard project from research to publication.
What’s inside
- Bring data to life with color and typography
- Choose the best chart types for your data story
- Design interactive visualizations
Table of Contents
Part 1
1. Hello, data viz!
2. How we perceive information
3. It’s all about the data
Part 2
4. Choosing colors
5. Typography
6. Creating a good chart
7. Designing for interactivity
Part 3
8. Research, design, and development
9. Troubleshooting
About the reader
For readers experienced with data analysis tools.
From the back cover:
Everyday Data Visualization gives you skills you’ll use to enhance the most common data visualizations, including charts and tables, data dashboards, and infographics. You’ll learn how to use color, typography, positioning, and choice of charts to catch and keep a viewer’s attention. Discover the finesse and design rigor that goes into building delightful dashboards, and best practices for live visualizations that flex and grow as underlying data changes. Design fundamentals are broken down into their component parts so they’re easy to understand, even if you’re the analytical type! Best of all, everything you learn is tool-agnostic, with universal principles you can apply to any data stack.
About the Author
Desireé Abbott has over a decade of experience in product analytics, business intelligence, science, design, and software engineering.










نقد و بررسیها
هنوز بررسیای ثبت نشده است.